ArcGIS Community Analyst is a cloud-based mapping solution to visualize and analyze demographic information using thousands of available variables.
A valuable tool that can answer questions essential for making policy decisions
- Where should we target money and resources to make the largest impact?
- Are there demographic trends occurring that we need to plan for?
- What level of impact will a policy decision have on a given population?
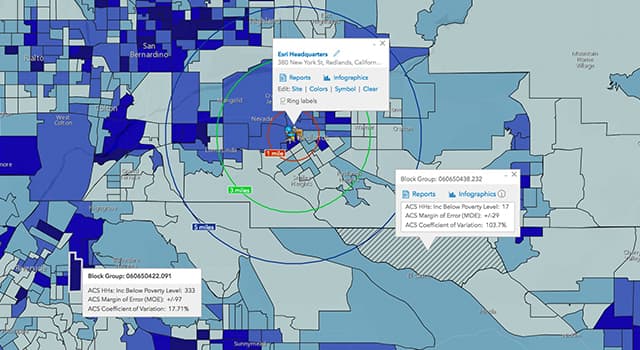
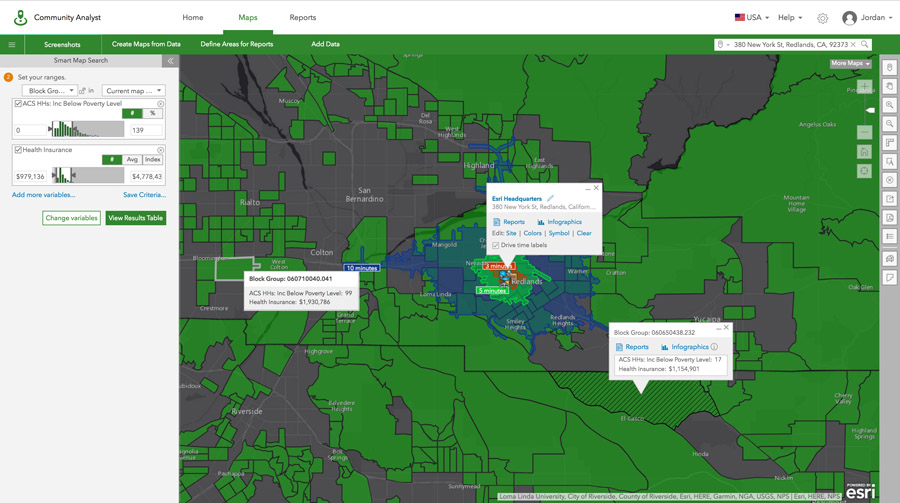
Analyze geographic areas, specific locations, or a custom region of your choosing. Create color-coded maps and reports of your highlighted data to depict important information and findings. Gain a deeper understanding of the challenges, opportunities and impacts that a policy decision will have on the community.
ArcGIS Community Analyst is loaded with key features to help you make the right decisions.
- Compare communities – access demographic, census, health, crime, and business variables, among thousands more data.
- Resource allocation – Create custom comparison reports to determine the best strategy for allocation of resources.
- Data-drive grant proposals – Leverage precise data to educate and inform key insights.
See how others are using ArcGIS Community Analyst
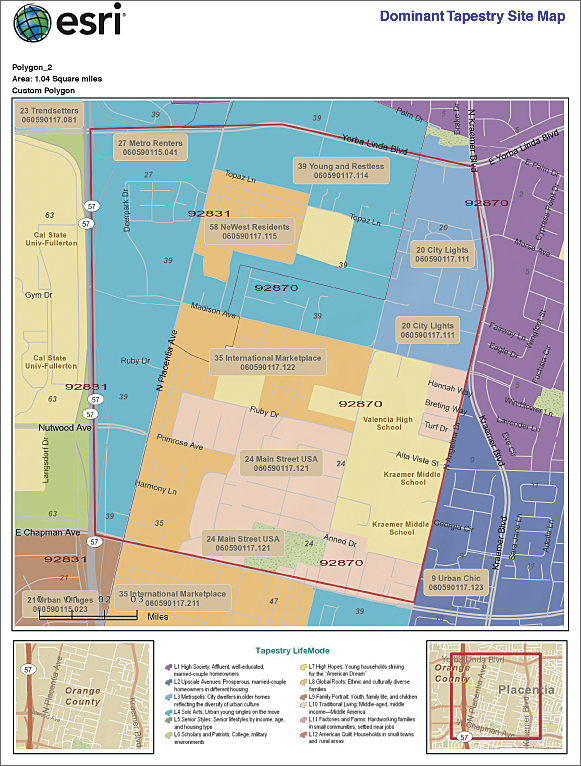
The City of Fullerton Looks Inward
The city was seeking a better understanding of the demographics and population counts for a specific area downtown.
“We were interested in knowing how many people visited during different times of the day and what the business climate was like.” – Diana McCarthy, GIS Specialist for the Development Department.
Taking advantage of ArcGIS Community Analyst, the city created a report outlining which type of businesses might consider opening new locations downtown based on mapped socioeconomic data. Access to this valuable tool, the city of Fullerton can relay key customer information to their local businesses to make accurate and informed business decisions.
Opening Up Health Reform
Staff at the Riverside County Department of Public Health value maps to promote and protect the health of their county’s residents. Serving two dozen cities and over 2 million people, they aim to ensure equal access to emergency medical services.
With a culturally diverse population, there are several at-risk groups including those with obesity and high rates of cardiovascular disease. Longtime users of ArcGIS for Server and ArcGIS for Desktop, staff have since taken advantage of a new tool, ArcGIS Community Analyst.
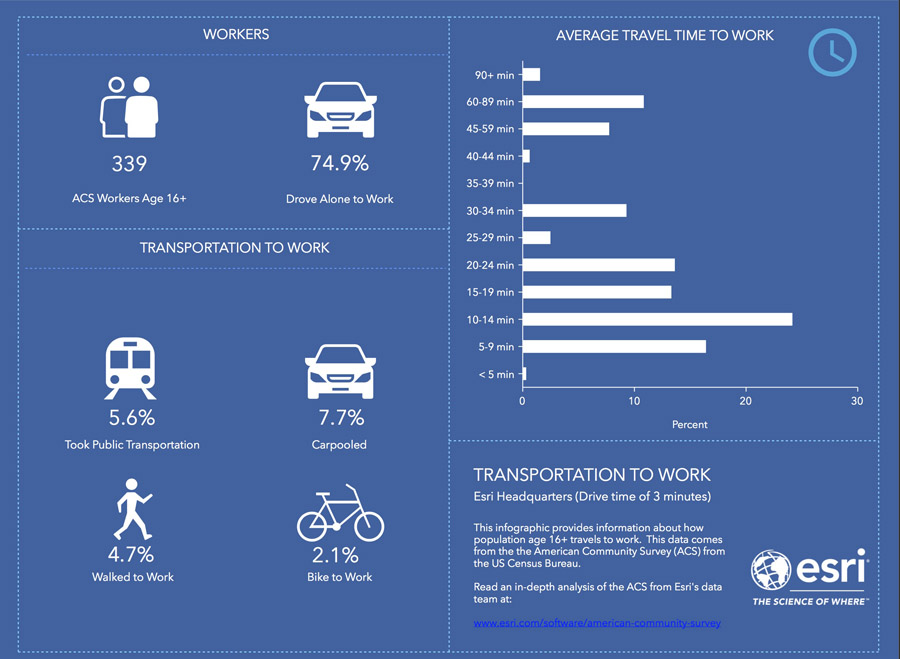
Specifically aiming using this tool to adhere to a health reform law, the county is ensuring that its clinical system serves uninsured and the low-income population. ArcGIS Community Analyst helped them develop a grant proposal by displaying a 60-minute drive time for areas surrounding each of their clinics. This easy-to-use web application met their needs quickly and efficiently, and provided answers to their difficult questions.
Get Support
Get all the latest data directly at your fingertips. Want to dive deeper and see how you can take advantage of this dynamic cloud-based mapping solution? Contact our GeoMarvel experts at support@geomarvel.com to learn more about ArcGIS Community Analyst.