Tapestry Segmentation is a system designed to identify consumer markets with geodemographic information. Combining residential traits with consumer data, Tapestry Segmentation can locate markets and accurately classify US neighborhoods by leveraging the power of cluster analysis, and integrating the latest data mining techniques.
The result is a robust and compelling segmentation of US neighborhoods. Tapestry Segmentation uses the most powerful data available including:
- Census 2010
- The American Community Survey (ACS)
- Esri’s Demographic updates
- Experian’s Consumerview database
- Survey of the American Consumer from GfK MRI
Key data collected include:
- Household characteristics – single person or family, income, relationships, tenure
- Personal traits – age, sex, education level, employment, marital status
- Housing characteristics – home value or rent, seasonal status
With all this data at your disposal, how are you supposed to know the right questions to ask?
- Is income best represented by a median, an average, or an interval?
- Would household or disposable income best measure actual buying power?
Tapestry Segmentation has a verified efficacy against consumer market surveys including 6000 product and service brands across 550 different categories.
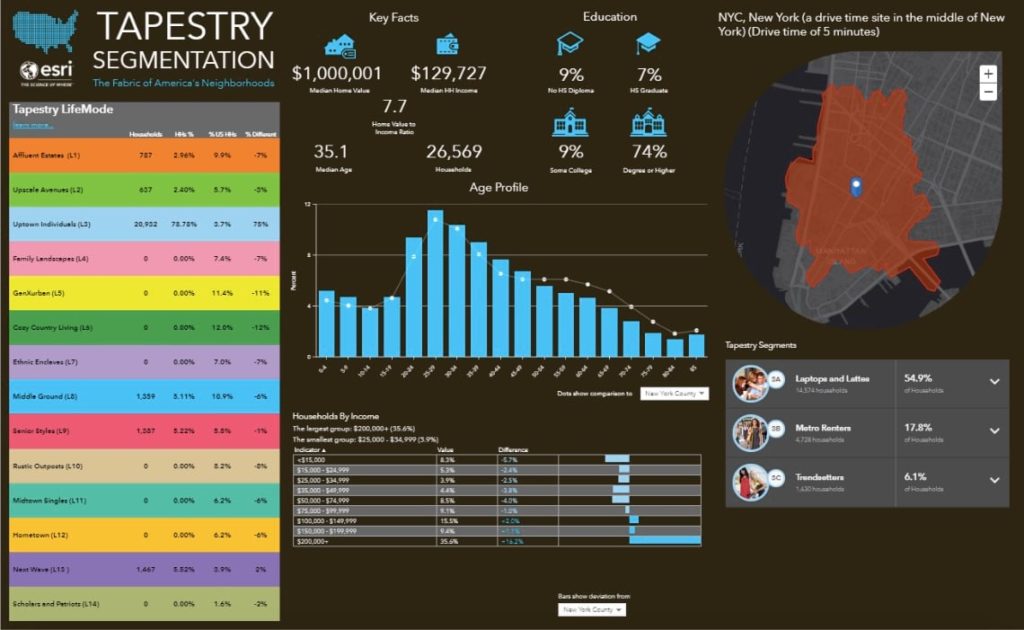
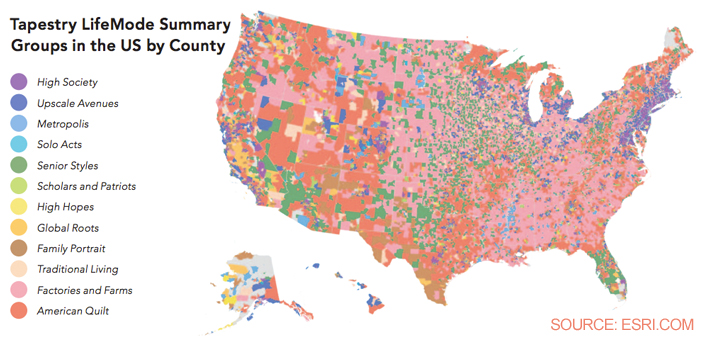
Based on socioeconomic and demographic composition, this tool has been able to classify 67 distinct markets. These segments have been classified into 14 different LifeMode groups. Each LifeMode group represents a market (based on lifestyle and lifestage) with a shared common experience (born in the same generation, immigration from another country, significant demographic traits).
14 LifeMode Groups
- LifeMode 1 – Affluent Estates – Top Tier, Professional Pride, Boomburbs, Savvy Suburbanites, Exurbanites
- LifeMode 2 – Upscale Avenues – Urban Chic, Pleasantville, Pacific Heights, Enterprising Professionals
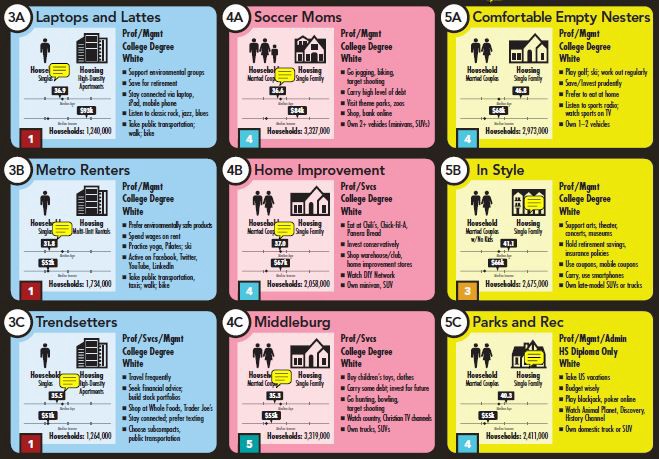
- LifeMode 3 – Uptown Individuals – Laptops and Lattes, Metro Renters, Trendsetters
- LifeMode 4 – Family Landscapes – Soccer Moms, Home Improvement, Middleburg
- LifeMode 5 – GenX Urban – Comfortable Empty Nesters, In Style, Parks and Rec, Rustbelt Traditions, Midlife Constants
- LifeMode 6 – Cozy Country Living – Green Acres, Salt of the Earth, The Great Outdoors, Prairie Living, Rural Resort Dwellers, Heartland Communities
- LifeMode 7 – Ethnic Enclaves – Up and Coming Families, Urban Villages, American Dreamers, Barrios Urbanos, Valley Growers, Southwestern Families
- LifeMode 8 – Middle Ground – City Lights, Emerald City, Bright Young Professionals, Downtown Melting Pot, Front Porches, Old and Newcomers, Hardscrabble Road
- LifeMode 9 – Senior Styles – Silver & Gold, Golden Years, The Elders, Senior Escapes, Retirement Communities, Social Security Net
- LifeMode 10 – Rustic Outposts – Southern Satellites, Rooted Rural, Diners & Miners, Down the Road, Rural Bypasses
- LifeMode 11 – Midtown Singles – City Strivers, Young and Restless, Metro Fusion, Set to Impress, City Commons
- LifeMode 12 – Hometown – Family Foundations, Traditional Living, Small Town Simplicity, Modest Income Homes
- LifeMode 13 – Next Wave – International Marketplace, Las Casas, NeWest Residents, Fresh Ambitions, High Rise Renters
- LifeMode 14 – Scholars and Patriots – Military Proximity, College Towns, Dorms to Diplomas
Urbanization groups is a simplified classification of markets, which is based on geographic and physical features, population, density, city size and location relative to a metropolitan area. The 6 Urbanization groups include:
- Principal Urban Centers
- Urban periphery
- Metro cities
- Suburban periphery
- Semirural
- Rural
See How it Works
See a Tapestry Segmentation Area Profile for a 1-, 3- and 5-mile radius around 100, S Wacker Dr, Chicago, Illinois.
Or discover the complex visuals of a Dominant Tapestry Map for Dallas County, Texas.
Get Support from GeoMarvel
Start understanding your customers better with an in-depth, accurate analysis of who exactly they are. Want to learn how to fully utilize the power of Tapestry Segmentation? Contact support@geomarvel.com to start a conversation with our GIS experts.