Have you ever taken a feature layer and done a REST call to get your data? Then transformed your data into a format that a chart library can use and understand? Well, it can be a pain. And this is why we like Cedar charting, as it was built for GeoServices. It’s an open source charting library built around the formats of spatial data!
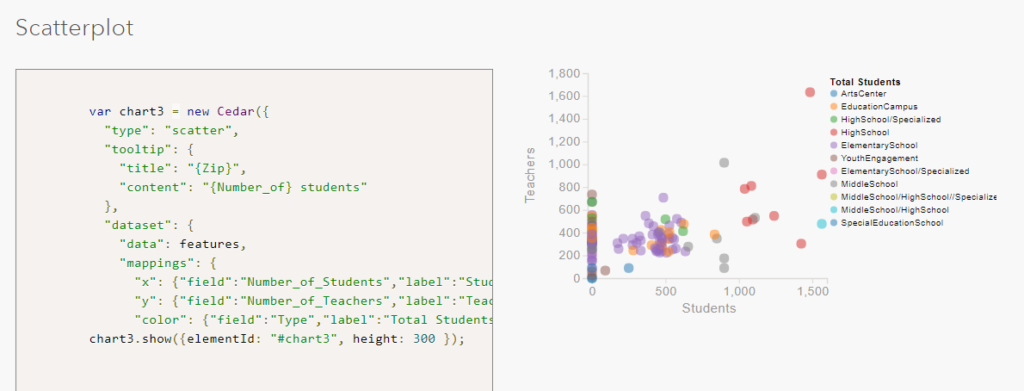
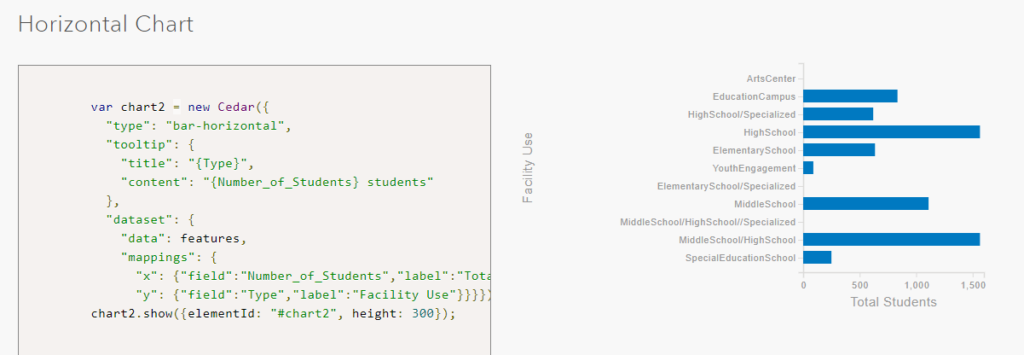
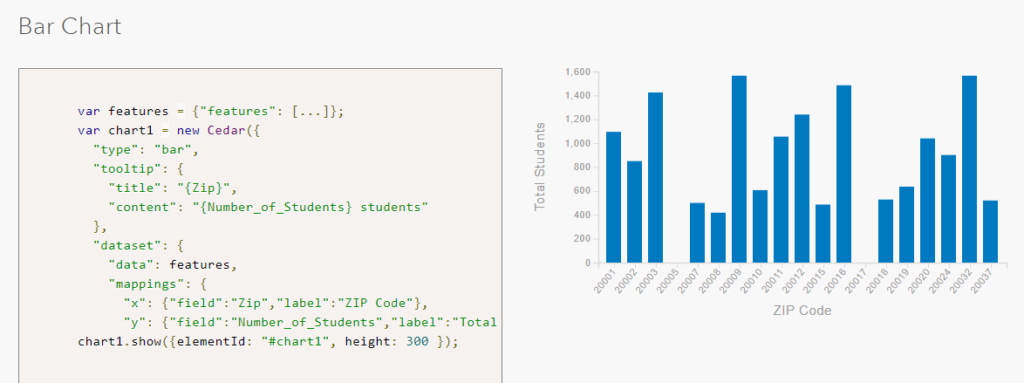
Cedar is a Javascript library for creating and sharing data visualizations with the GeoServices API from ArcGIS. Cedar charting allows for creation of simple and efficient data visualizations and charts, including bar charts, line charts, scatter plots, and more, all using a simple template.
Take a feature service and perform a query statistics, and convert data into a schema that can be understood by the opensource charting library available on esri’s github site.
Contact our development experts to start leveraging Cedar charting today.