How will you visualize real-time data with ArcGIS GeoEvent Server?
Real-time visualization is possible with stream services from ArcGIS GeoEvent Server. Backed by a spatiotemporal big data store or an Enterprise GDB, this service doesn’t require storage and has a low latency. Analyze millions of data points quickly and easily with ArcGIS GeoEvent Server.
Stream services can track moving assets, monitor stationary sensors, or follow social media feeds. Display and analyze the Internet of Things, and automatically update maps to send alerts when a given threshold is met.
Leveraging data from the spatiotemporal big data store offers a variety of options.
• Visualize on-the-fly aggregations of data
• Perform exploratory queries over any combination of space, time, and attributes
• Switch visualization from aggregation to raw features
• Inspect feature attributes while in aggregation or raw feature view
• Replay (via time slider) historic observation in aggregation or raw feature view
Leverage Powerful Tools like Motion Calculator
With Motion Calculator, all you need is geometry and a timestamp. When monitoring vehicles, these simple inputs can provide deep insights relating to the vehicle’s speed, heading, and slope. Map and symbolize your detailed data with Motion Calculator.
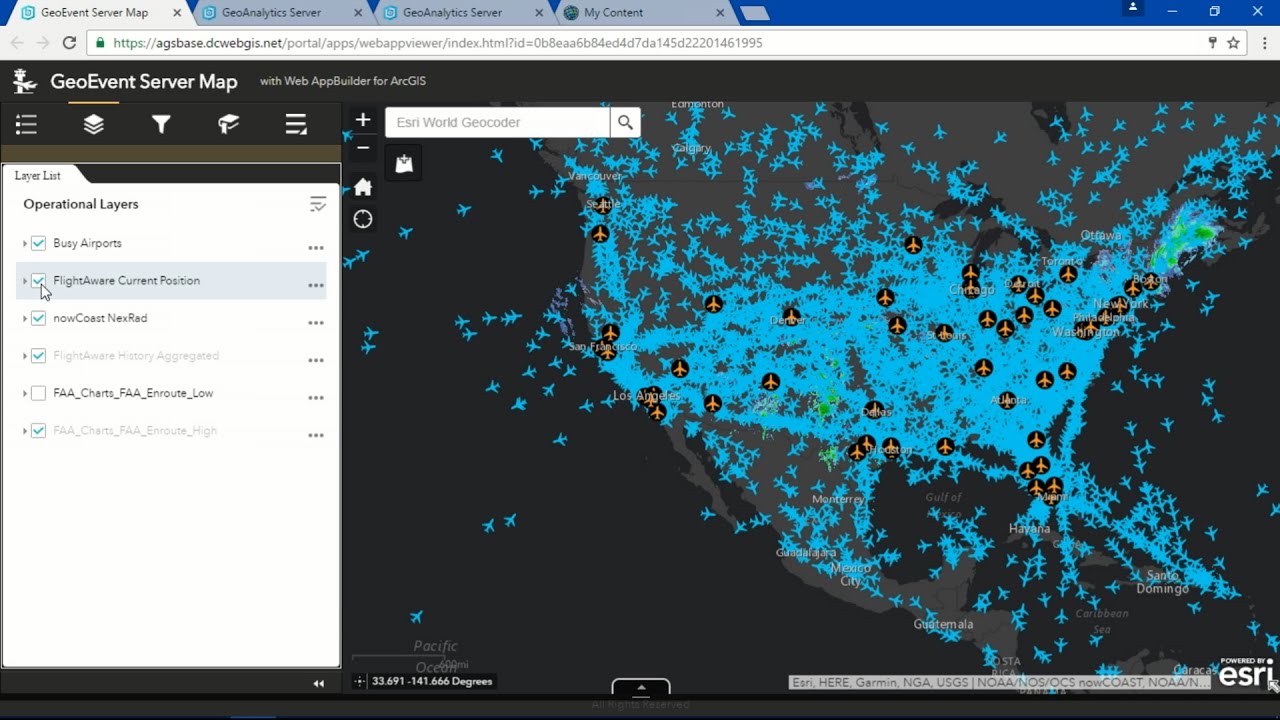
Visualizing Real-time Data
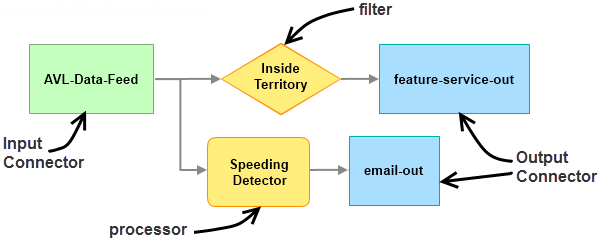
Visualizing real-time data is easy when getting started with GeoEvent Server. Start by adding an input connector to stream your desired data. Or create your own inputs with GeoEvent Manager.
With an input connector hooked up, the map feature layers will populate in regular intervals to display the most current observations. Stream layers are more responsive and efficient than feature layers, as they display immediately and automatically refresh at set intervals. Using a stream layer works the same as a feature layer – simply copy the URL for the stream service to add the layer from the web.
Get Support
Are you ready to take full advantage of GeoEvent Server for real-time awareness and analytics? Check out the ArcGIS GeoEvent Server Gallery for a ton of great information and ideas from the esri community. Don’t hesitate to reach out to our industry experts to start a conversation today, and see how GeoMarvel can help you get the ball rolling quickly with GeoEvent Server.