Preparing for Rising Sea Levels – What are we wading for?
Sea levels have been rising at staggering rates in recent years. For the 6th consecutive year the global mean sea level has increased over the previous year. Putting the 2017 global mean sea level 3 inches above the 1993 average.
Why are sea levels rising?
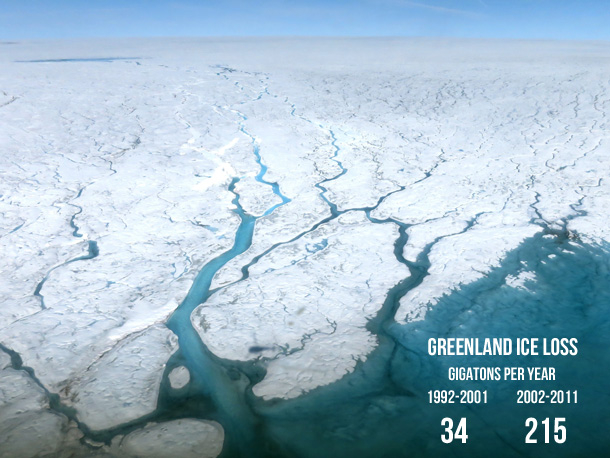
Melting ice sheets and glaciers are dumping gigatons of water into the ocean, which is increasing the overall volume of water held in the ocean. Ice loss from the Greenland ice sheet has increased six-fold, from an average loss of 34 gigatons/year, up to current estimates of over 215 gigatons/year.
Read more – 3 Ways Climate Change Affects our Ocean
How will rising sea levels impact coastlines?
In the United States, 40% of the population lives in high-density urban areas near the coast. Thus rising sea levels can have a significant impact on those urban centers, damaging local infrastructure like roads, subways and treatment plants, to name a few.
A higher baseline sea level will create disastrous consequences. Future hurricanes will be even greater threats, as the water will push further inland than ever before. Nuisance flooding (which is 3 to 9 times more common than it was 50 years ago) will become ever more frequent, driving saltwater into our freshwater aquifers. Mixing saltwater with freshwater can damage natural ecosystems, and impact agricultural water supplies.
Dive into Sea Level Trends with this map available from NOAA
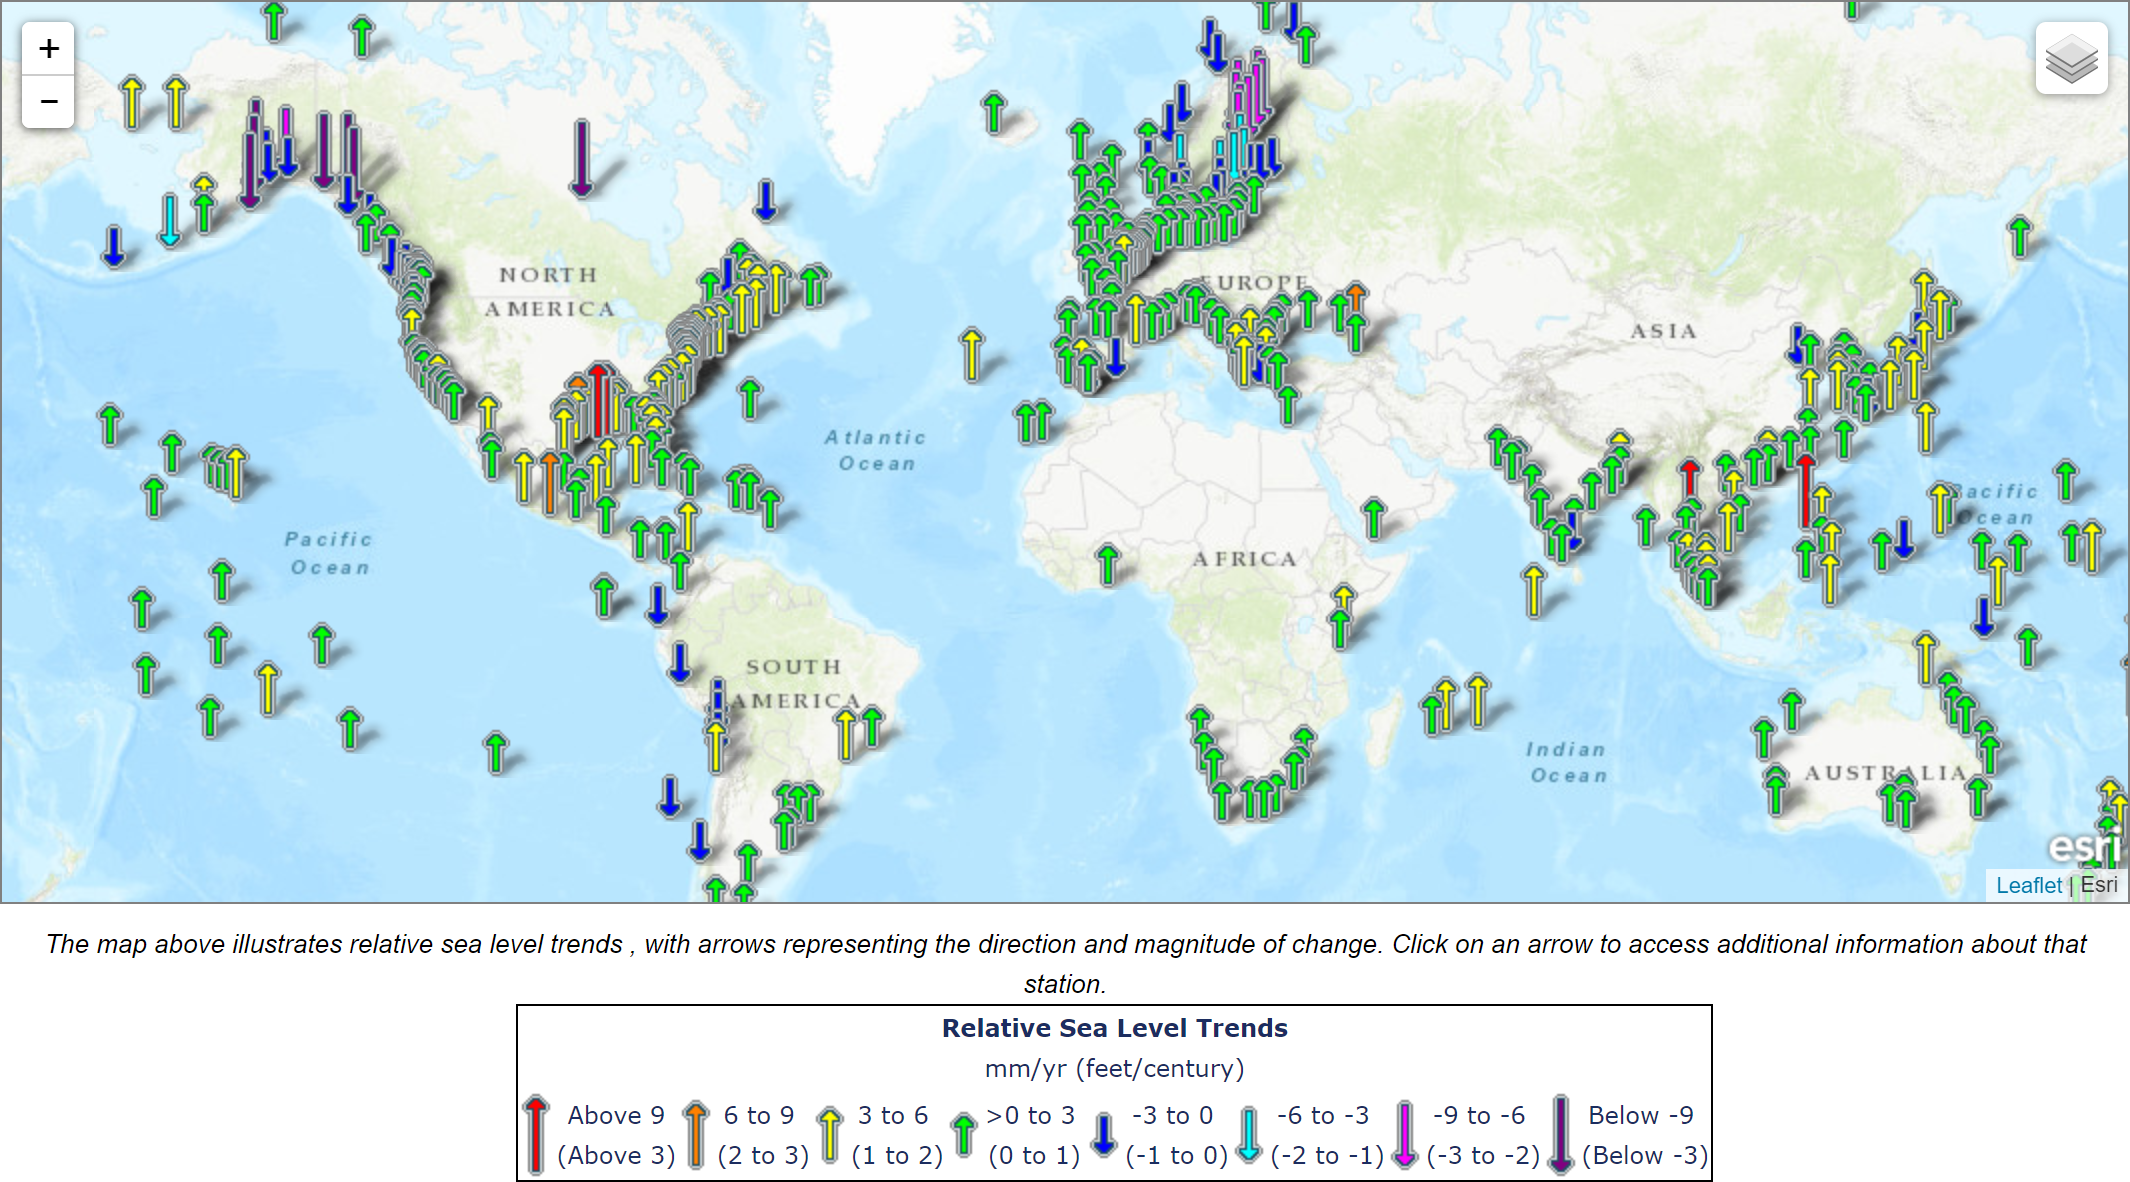
NOAA’s Sea Level Rise Viewer Map
Let’s explore the Sea Level Rise Viewer map made available by NOAA, the National Oceanic and Atmospheric Administration. This application provides a tool to visualize the community-level impacts that may occur from sea level rise and subsequent coastal flooding. Targeting the coastal management community, the application provides datasets ranging from satellite imagery to economic data.
Zooming into southern Louisiana, let’s examine how incremental rises in sea level would impact the local area. Working in the “Sea Level Rise” tab, the interactive map provides a simple slider to increase or decrease water levels. As you change the severity of sea level rise, the map provides clear visuals outlining the impacted areas.
The next tab, “Local Scenarios” provides a variety of predictions for sea level rise in 10-year time steps. Predictions range from “Intermediate Low” to “Extreme”. With “Extreme” predictions reaching 10+ foot rises in sea level by 2100.
The “Mapping Confidence” tab provides sea level rise estimates, with associated confidence levels ranging from low to high. As shown in the legend, the blue areas represent areas of high confidence, while the orange colors depict lower confidence levels. Using the slider, we can alter the amount of sea level rise and witness how this impacts the Washington coast.
Moving on to the “March Mitigation” tab, let’s take a look at how rising sea levels would impact the local wetlands. The first 6 inches of sea level rise appear to have a significant impact on the local wetlands, increasing their numbers drastically. As sea levels continue to rise, water continues to encroach upon the land, quickly overtaking large urban areas.
The “Vulnerability” tab displays coastal areas with varying degrees of vulnerability to rising sea levels. Taking a closer look at the Washington D.C. area, we can see many high vulnerability areas here, where minor rises in sea levels can have a tremendous impact on the local area.
The Sea Level Rise Viewer offers more than visuals. You can freely download a wide range of data pertaining to coastal areas and rising sea levels. Simply click the download icon in the top right corner of the page, choose your area of focus, and download data for all your coastal management needs.
Looking for more coastal data? Check out the Data Access Viewer for coastal imagery, land cover, and elevation data.
How can we combat the inevitable changes and impacts from sea level rise? We can start by leveraging GIS technologies and geospatial insights to help us make smarter decisions surrounding our coastal management.
This blog has provided valuable data sources, from which coastal management communities can make smarter, more informed decisions to combat rising sea levels. By integrating coastal data with GIS technologies, we can uncover new strategies, share stories to educate the community, and work together to fight for the future of our coasts.
Hoping to take your data a step further?
GeoMarvel can help. Explore our range of professional services, and our vast portfolio to see some of our past successes. Ready for the next step? Reach out to our GIS development experts to start a conversation about your unique project needs.