Esri Demographics offer a vast collection of demographic, psychographic and socioeconomic data. This group of data sets includes over 15,000 data variables from 130+ countries. With regular updates, including the latest June 2019 release, the data provides the highest quality information to assist in your workflows.
These data sets provide a wide range of information, which are ready to be integrated with maps, apps, and infographics. Let’s explore a few of the data sets that were recently updated.
2019 USA Tapestry Segmentation
Esri’s tapestry segmentation data goes beyond mere demographics. Tapestry segmentation classifies neighborhoods into 67 unique segments with detailed demographic and socioeconomic data. Learn more about Esri’s tapestry segmentation here.
2019 USA Retail Goods Spending
The Living Atlas of the World offers a wide variety of spending data for populations around the world. Dive into the data for money spend on alcoholic beverage in the United States, discover the average household spending in Spain, or reveal spending trends on public transportation in Australia.
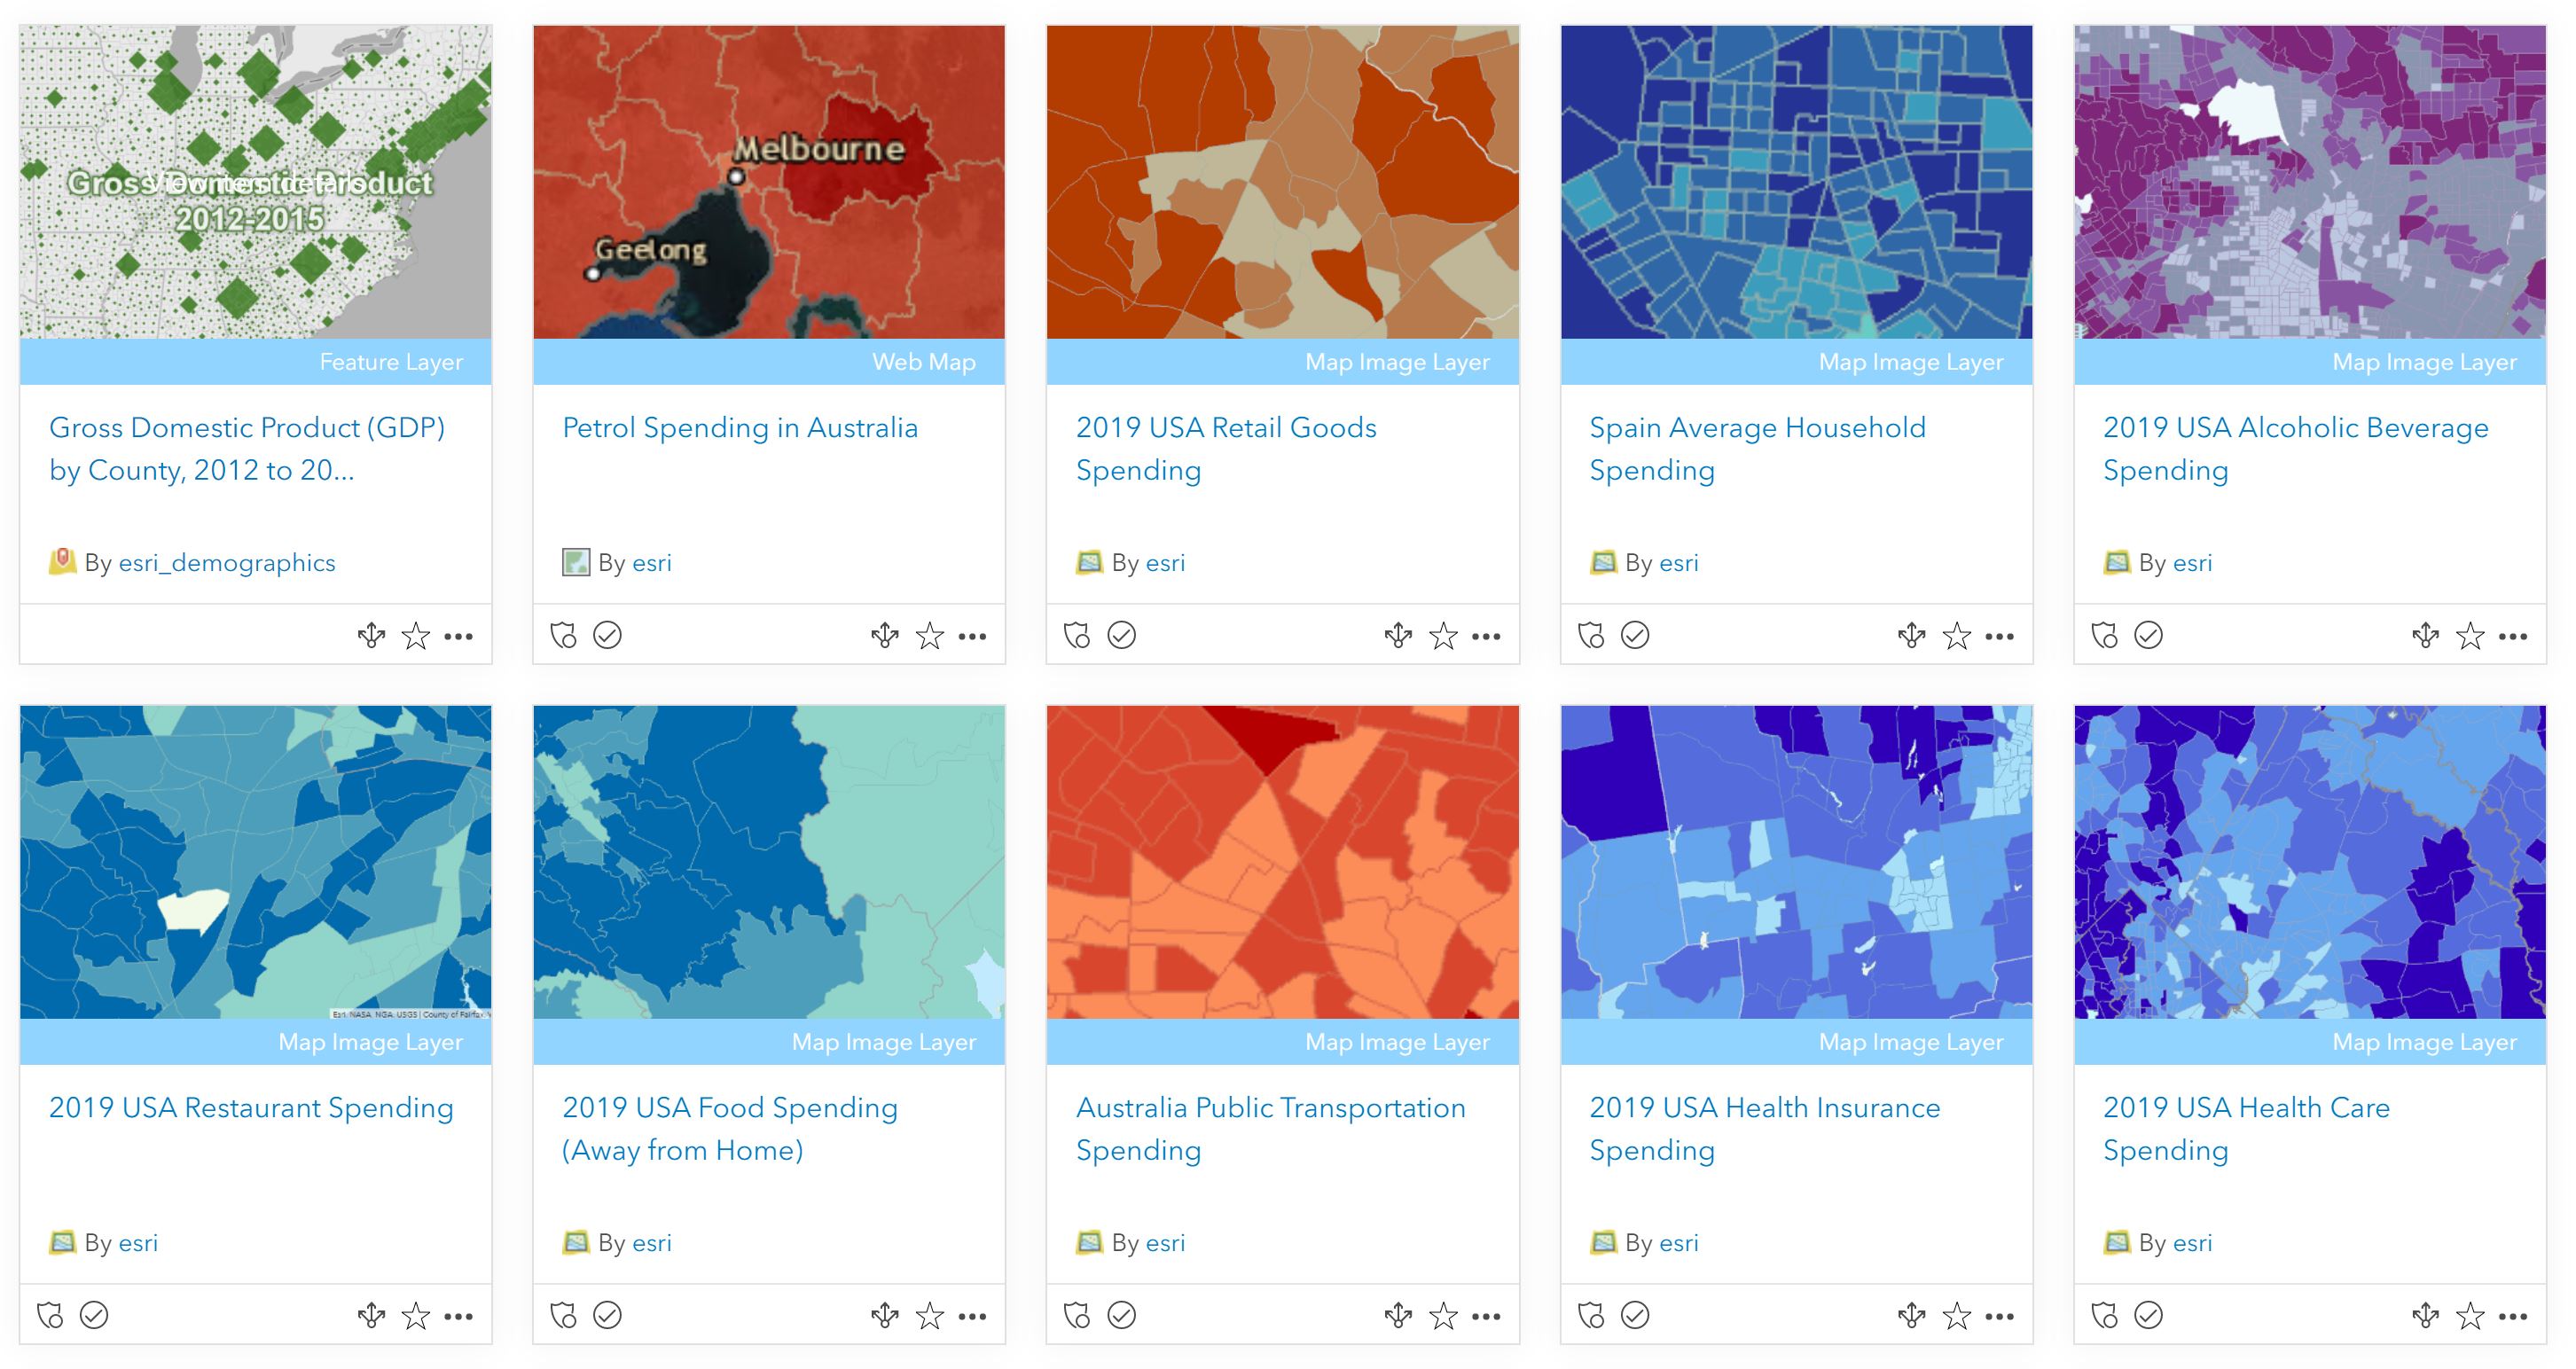
The map view of spending on retail goods depicts country-wide, color-coded data showing spending per year, per household. The legend on the left explains each color, and the dollar range of spending associated with that color. Explore the data for yourself to get a better sense of retail goods spending in your neighborhood.
2019 Market Potential
From who uses online banking to recycling habits, the Living Atlas offers insights into a range of niche topics.
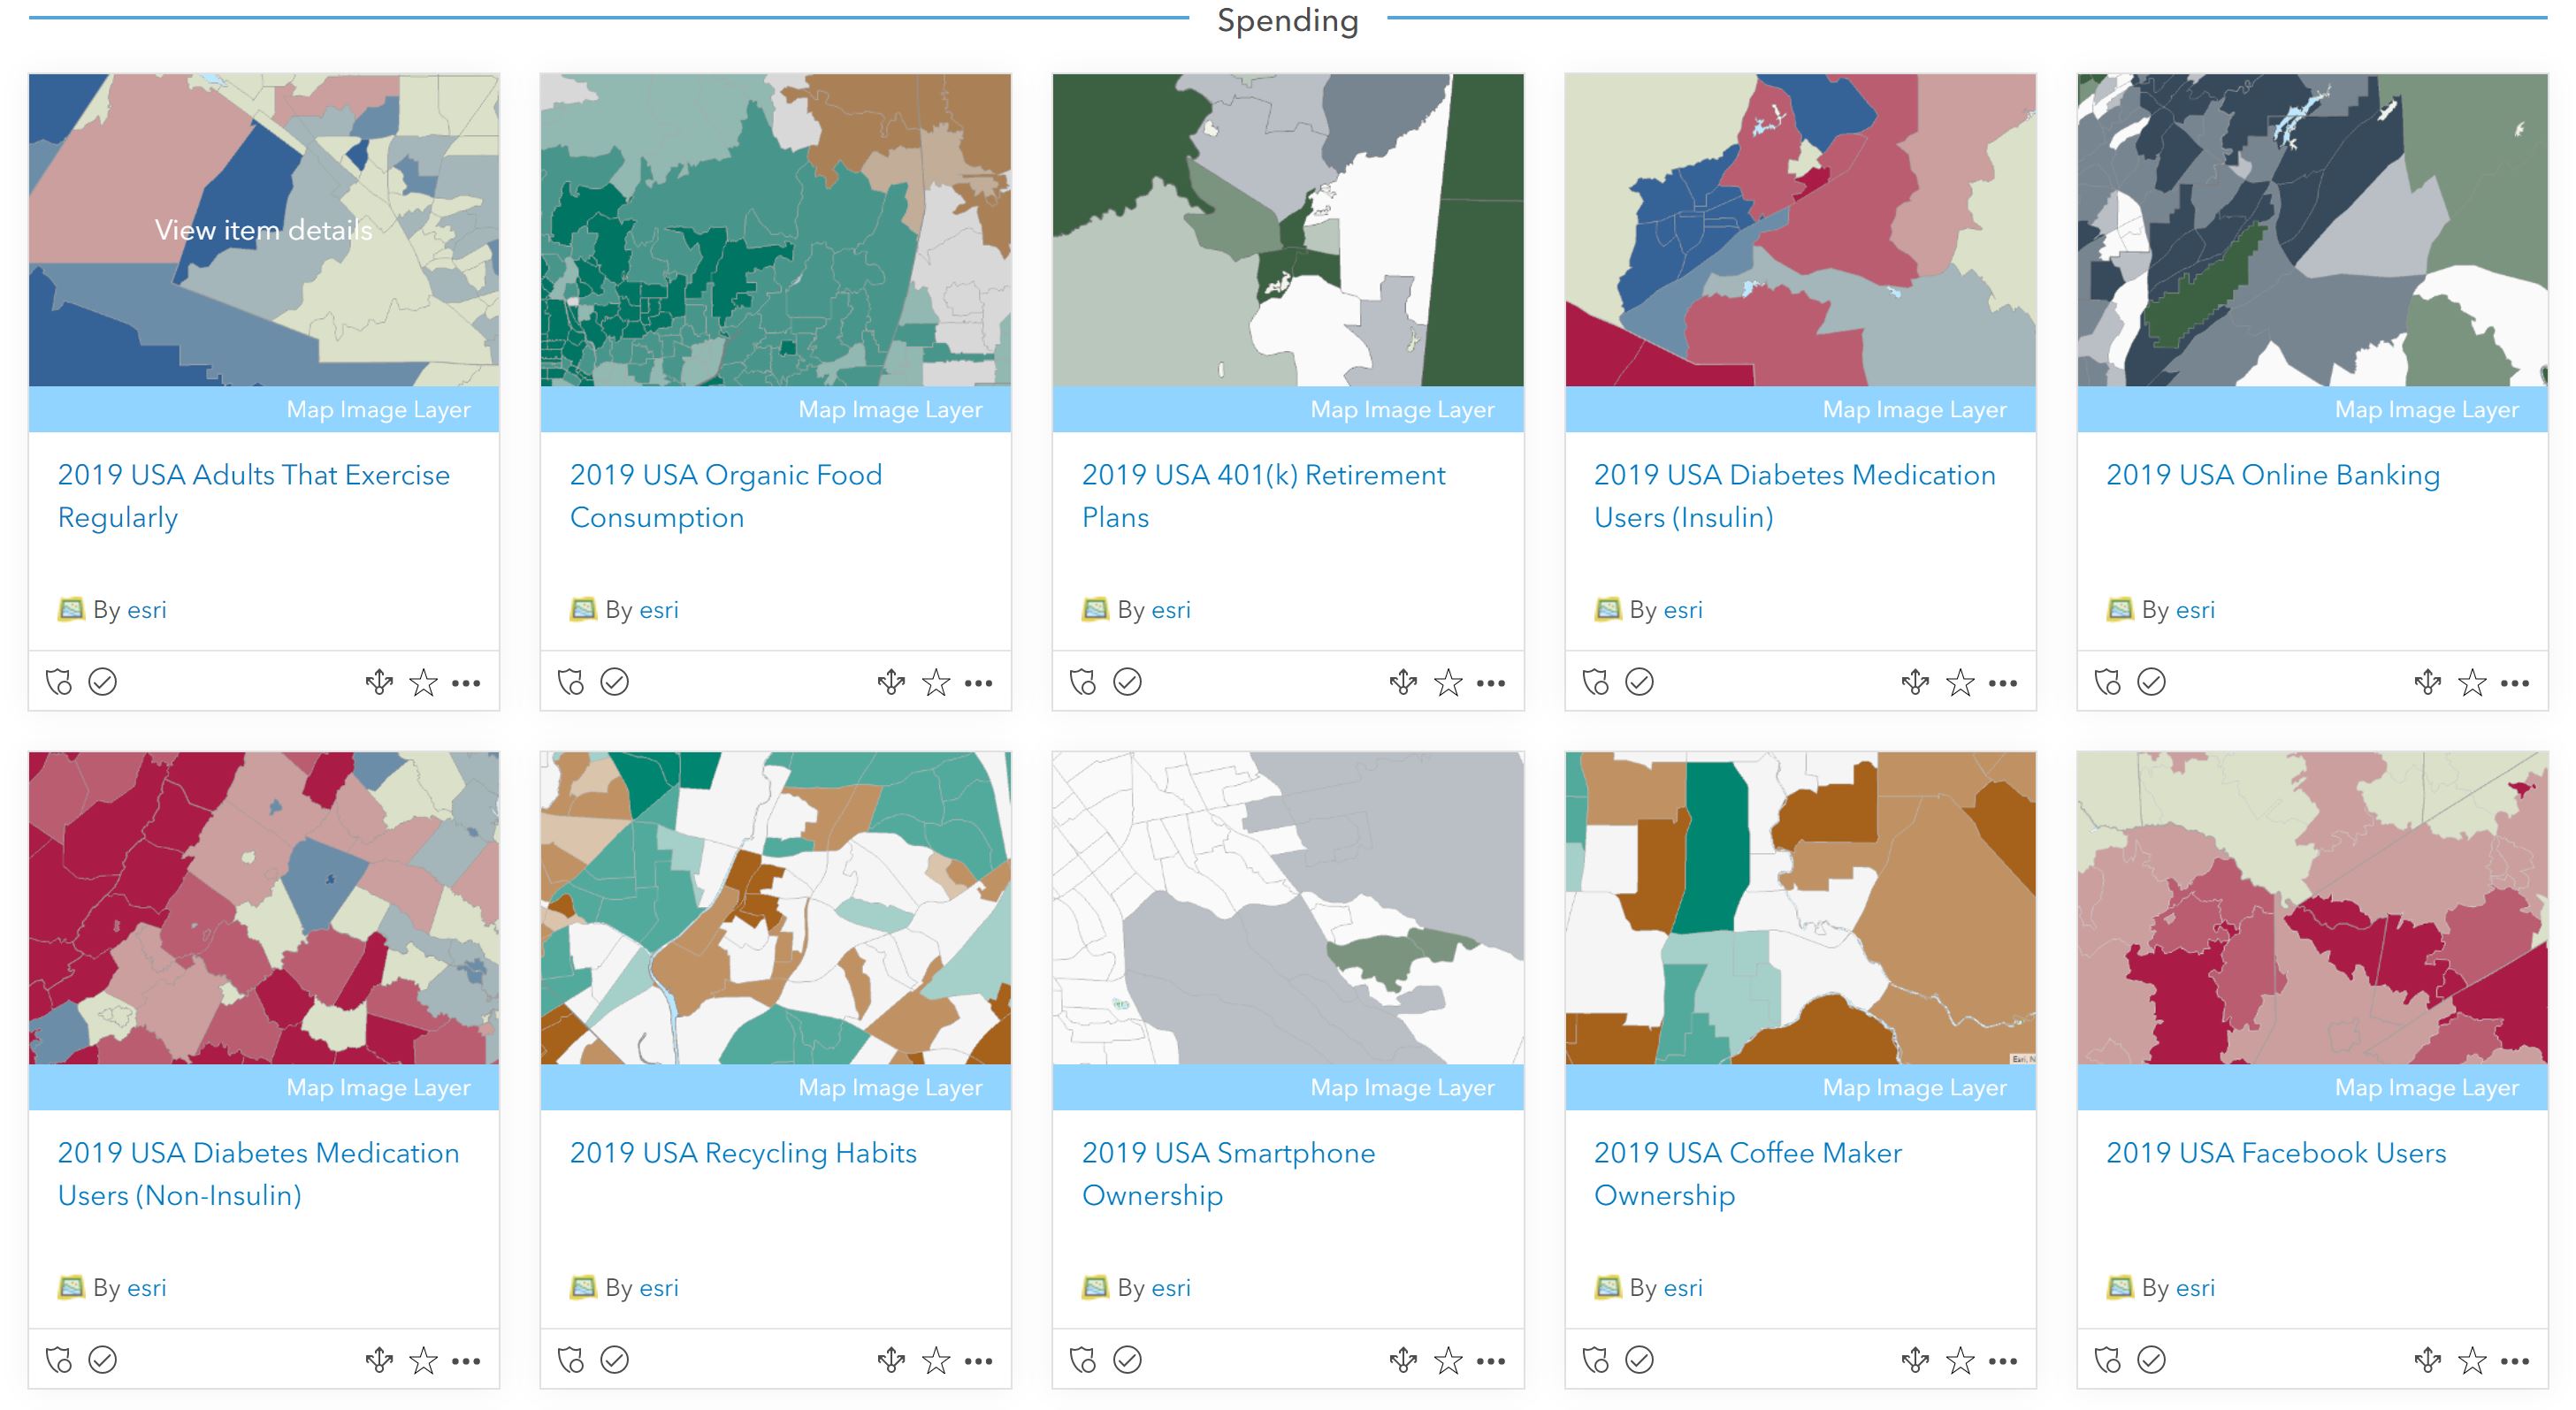
2019 USA Recycling Habits
Initial views of recycling habits in the US reveal below average recycling rates in much of the Southern United States. Let’s zoom into a greener area to see what the data tells us about East Coast recycling habits.
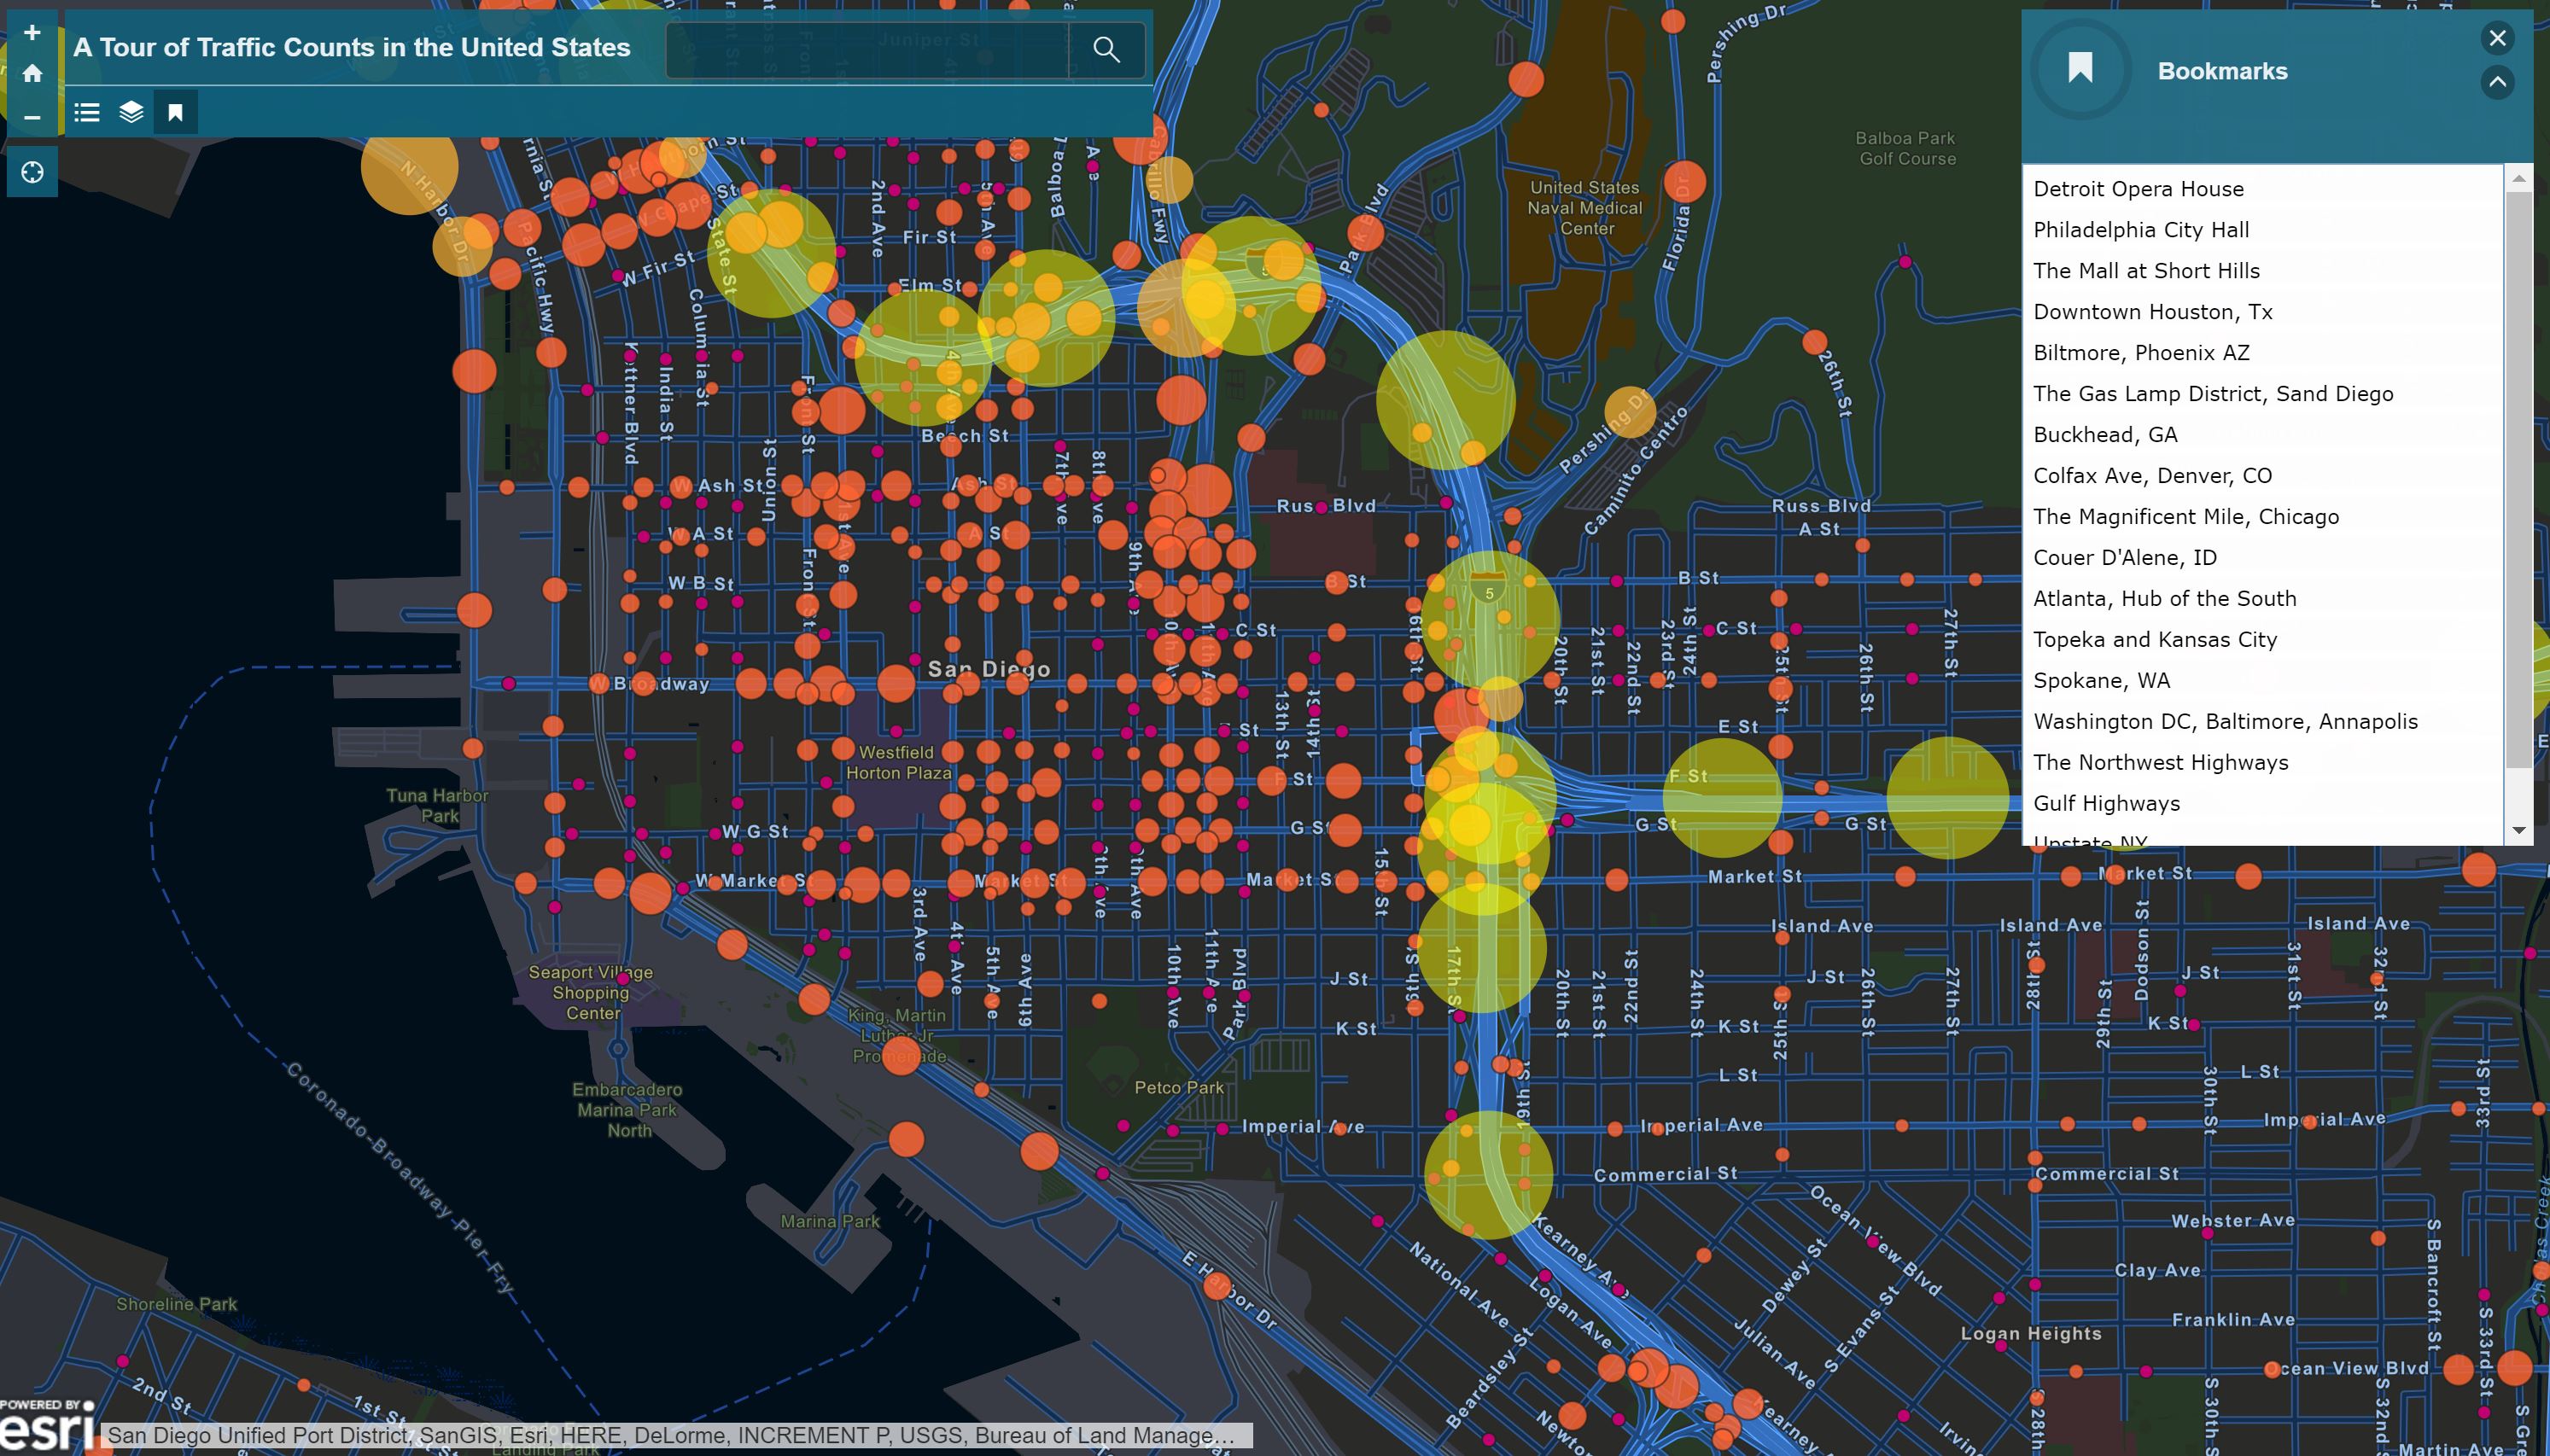
2019 USA Traffic Counts
Leverage traffic counts to determine the location of your next store, billboard, or other advertisement. Discover which locations get the most traffic, and where the data says people rarely drive. The pop-ups from this data source provide further details on the most recent traffic counts, include the year the count was taken.
Ready for more? Take the tour of traffic counts in the United States, and explore the full set of bookmarks leading you around the country.
2019 USA Crime Index
Interested to see the crime statistics in your area? Explore the latest updates to the USA Crime Index to see how crime rates in different areas rate against the national average.
Get Support
Interested in leveraging data from the Living Atlas of the World? Reach out to our industry experts to discuss your unique GIS needs. Whether you’re a GIS pro, or completely new to the technology, GeoMarvel can help you get up and running quickly.