Electric utility companies have to manage assets in a variety of terrains. Transmission and distribution lines might run through prairie, desert, mountains, or forest. No matter the terrain, it’s essential to properly manage encroaching vegetation to maintain a safe and functional network.
Vegetation and tree-related incidents are a common cause of power outages, and are a major contributor to mass blackout events. Inadequate vegetation management can also spark wildfires, even if the vegetation isn’t directly touching a power line.

– August 2003 – Trees collided with a power line in Ohio, leading to the largest blackout in North American history, affecting 50 million people, costing 6 billion dollars, and leading to 11 deaths.
– October 2017 – Poor vegetation maintenance led to 12 utility-related wildfires, with 8 deaths directly attributed to improper maintenance practices.
Identifying Dangers with Remote Sensing
GIS offers a range of technologies to assist in proper vegetation management practices. Before we start organizing vegetation management practices, we first need to be able to detect areas where vegetation sits near power lines.
LiDAR stands for Light Detection And Ranging. This remote sensing technology leverages pulsed laser light to detect and identify objects in 3D space. It’s an effective tool for locating vegetation that’s in close proximity to electric utility lines. As the technology has grown, image collection costs have decreased, providing a feasible technique for revealing the location of vegetation in dangerous areas. In addition to classifying vegetation, LiDAR technology can detect and identify utility poles, distribution lines, tree volumes, buildings and other nearby objects.
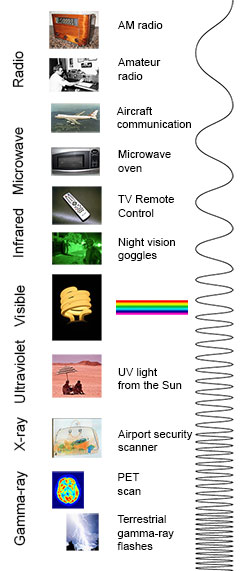
When LiDAR is fused with hyperspectral imagery, a world of possibilities opens up. Hyperspectral imagery gathers data from the entire electromagnetic spectrum. Beyond light waves, hyperspectral imagery also collects radio waves, microwaves, infrared light, ultraviolet radiation, X-rays and gamma rays.
By viewing vegetation through various wavelengths, we can collect more than just 2D satellite imagery. Hyperspectral imagery can characterize individual tree species and health status on a large scale, providing an in-depth understanding of species composition in an area. With this additional information, it’s much easier to determine differing growth rates between species of vegetation. Knowledge of growth rates can help determine the urgency of vegetation management needs in a given area, based on which species reside there.
Video from NM Group
Proper Vegetation Management with GIS
In order to ensure proper vegetation management, we must first ask a few important questions.
Who is going to manage the vegetation?
How can we tell when an area was last serviced?
Which area should be serviced next?
How much time should pass between services in a given area?
The ArcGIS platform provides a suite of technologies and applications that can streamline the process of vegetation management. Workforce for ArcGIS is just one piece of the puzzle for efficient vegetation management.
Workforce for ArcGIS
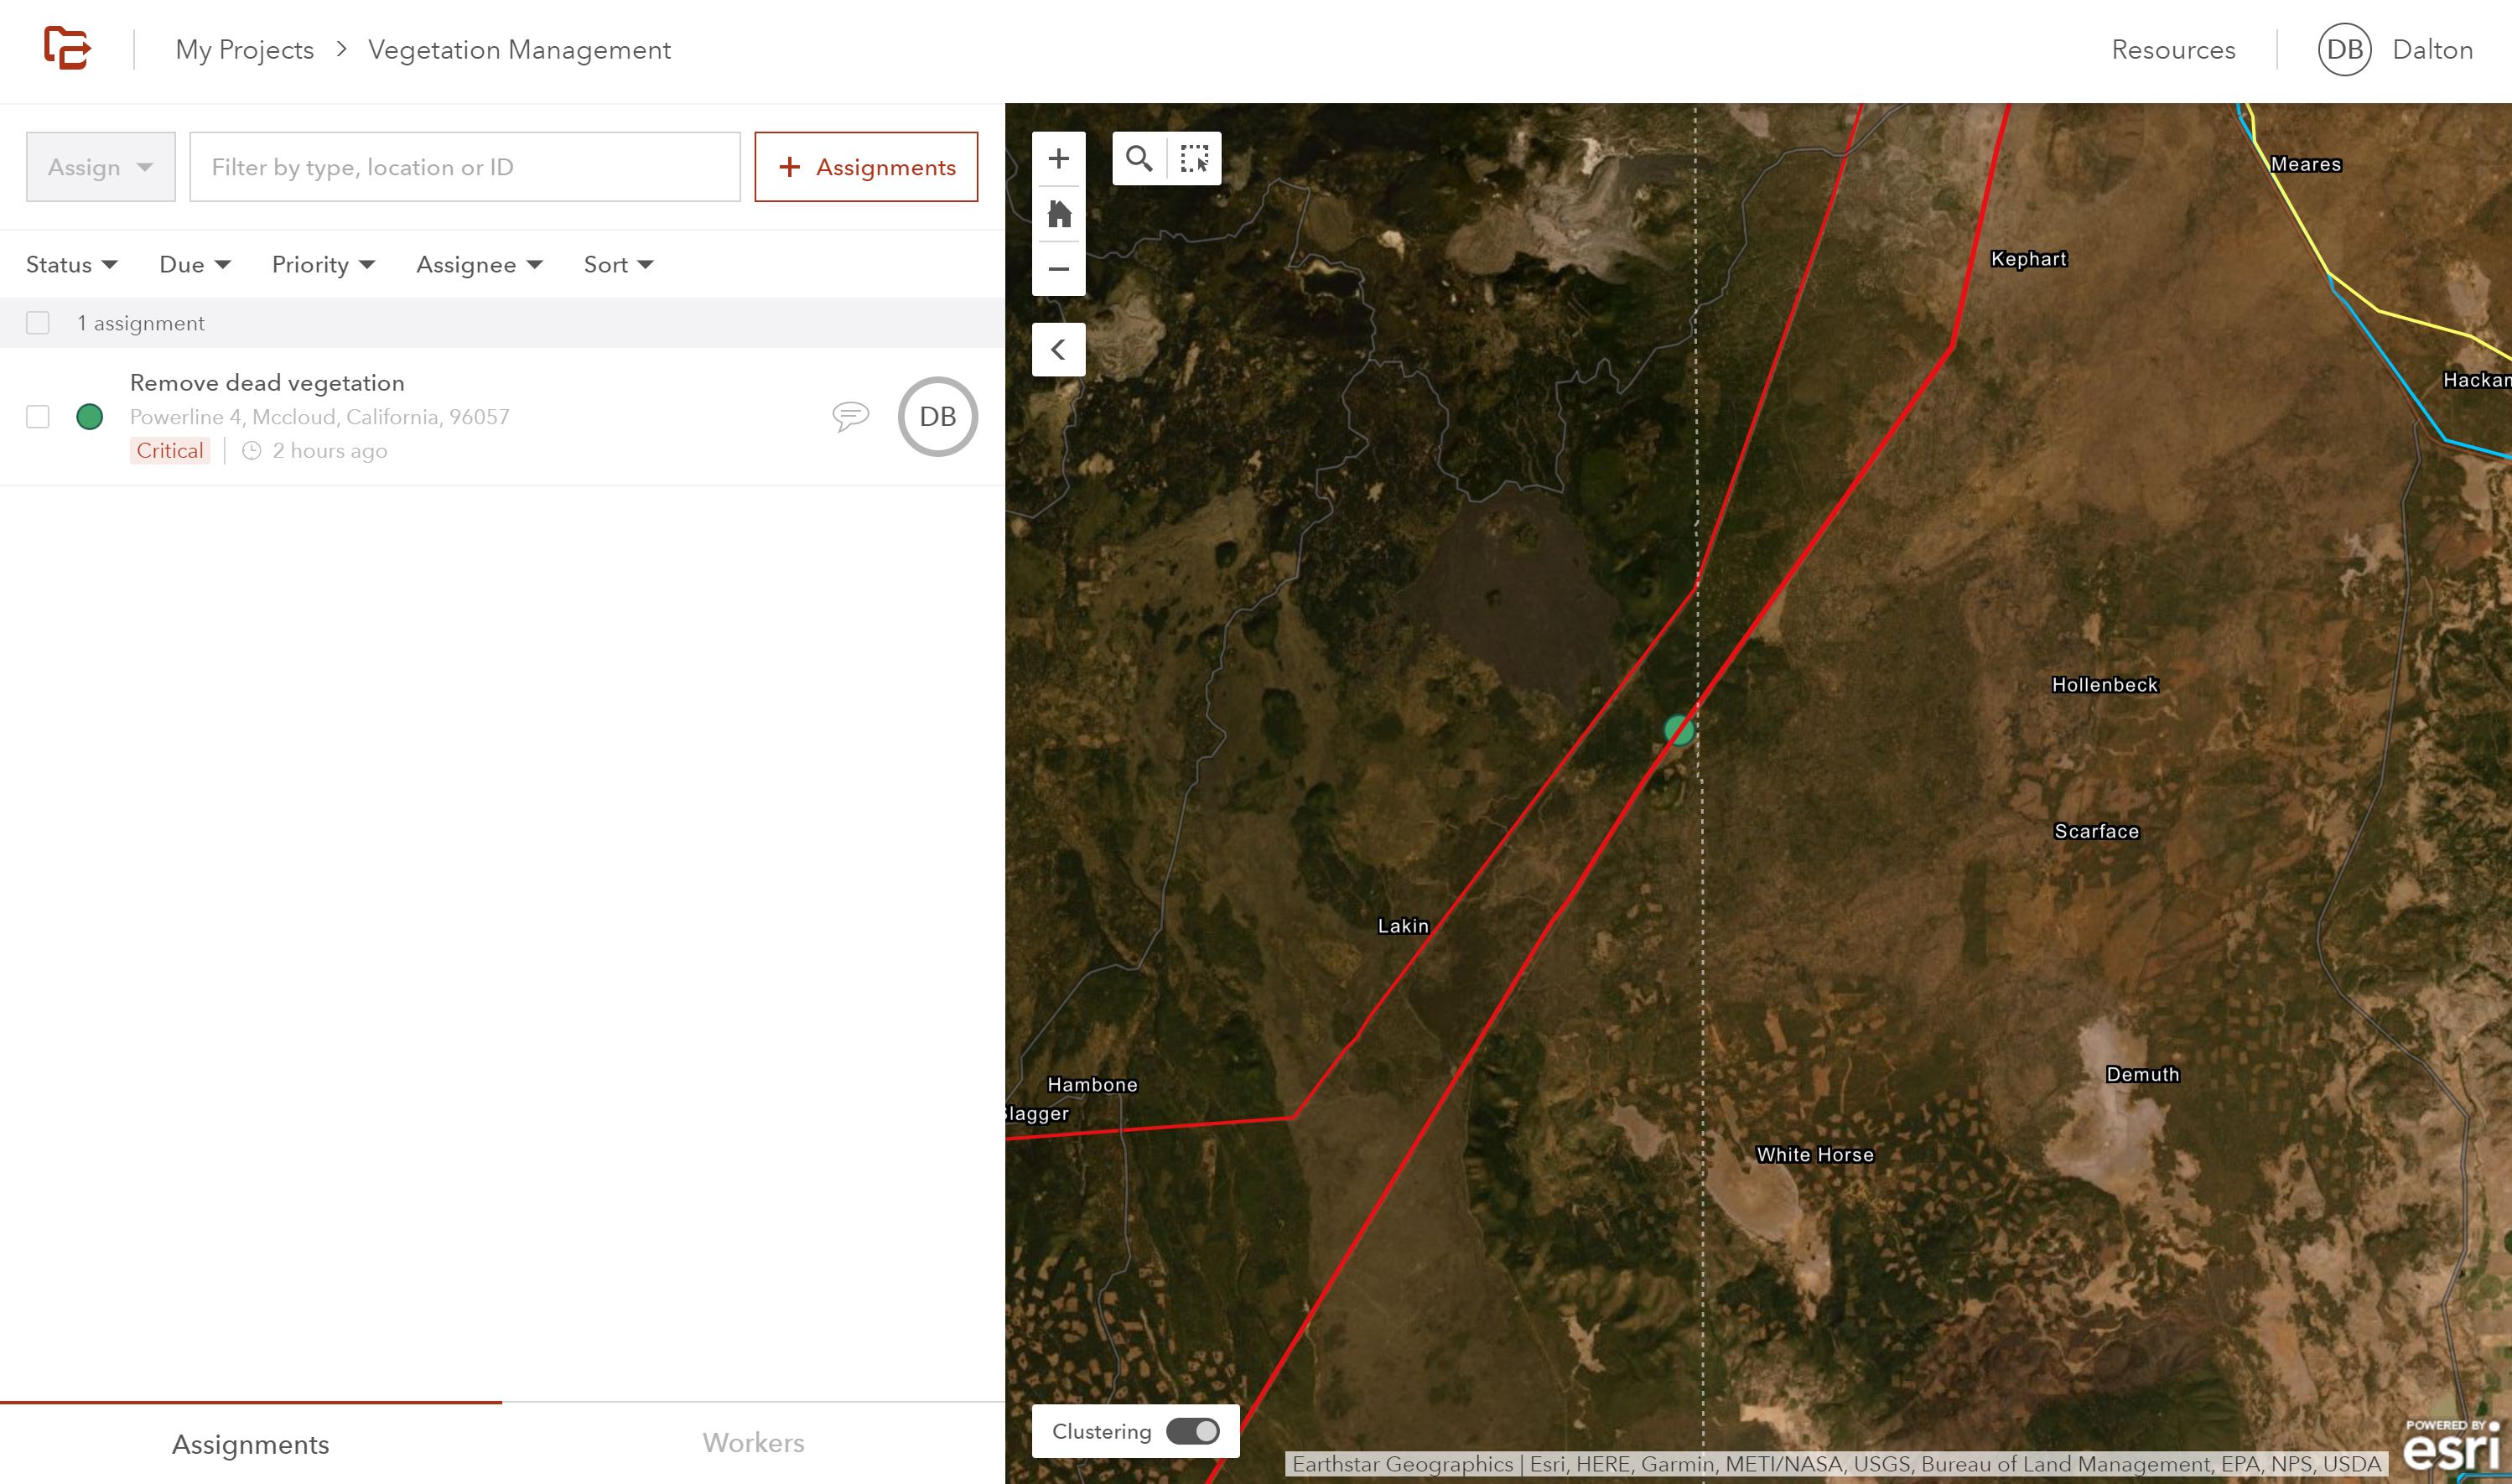
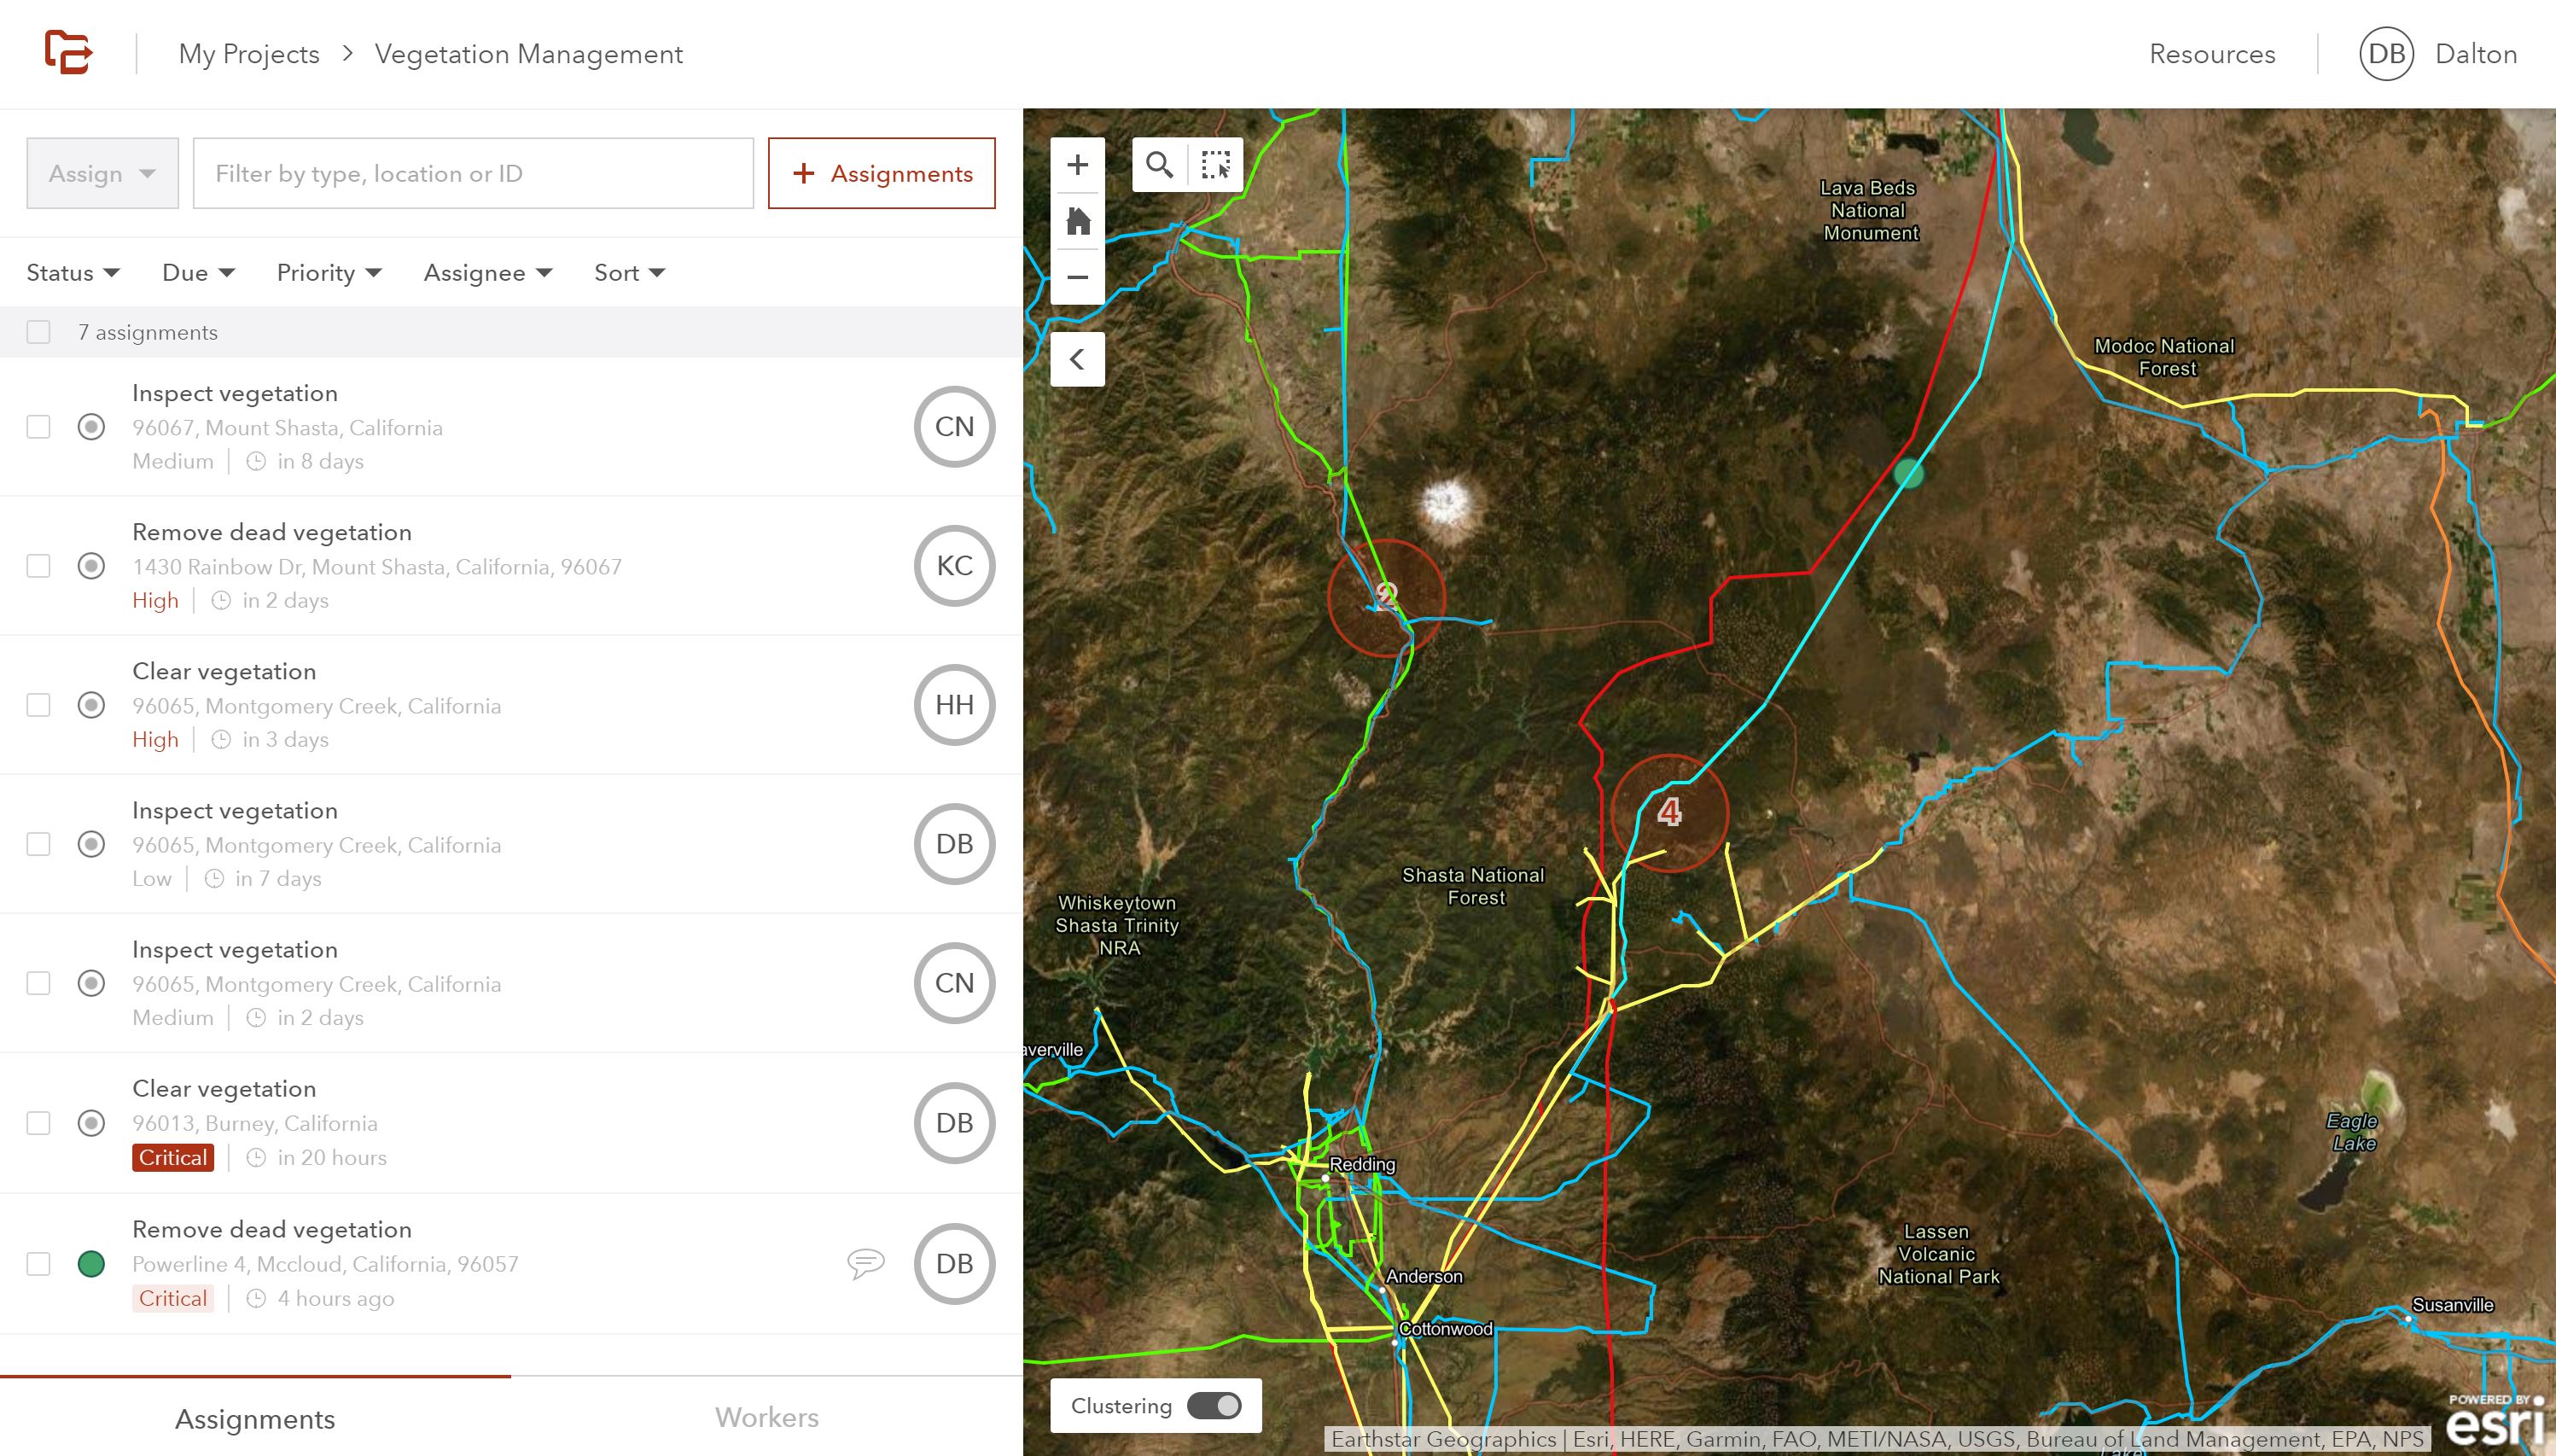
Workforce for ArcGIS is a mobile application solution leveraging the power of location to effectively coordinate field work. The vegetation management team consists of crews of workers moving around the field to clear dead and encroaching vegetation, and one or more dispatchers back in the office to coordinate efforts and assign tasks based on priority.
The dispatcher gets a full view of what’s going on, including each crew’s location, task list, and completed jobs. Field crews have Workforce for ArcGIS on their mobile devices, where they can receive new job assignments on-the-fly, and mark jobs complete as they wrap them up.
Field workers are notified of new assignments right away. They can identify the location of their latest assignment and set the assignment status to “Working” once they’ve begun. With easy attachment viewing, field workers can see the files attached to the assignment by the dispatcher. In this instance, the field worker can see the picture of a fallen tree that’s hanging on an active power line. Once the tree has been successfully removed, the field worker simply sets the assignment status to complete, which then informs the dispatcher in the office.
Go further with the ArcGIS Platform
The ArcGIS platform includes a suite of powerful applications to help you go further. Collector for ArcGIS, Survey123 for ArcGIS, and Operations Dashboard are just a few of the tools that can help in your vegetation management practices.
 Collector for ArcGIS is a powerful data collection app that’s built for the field. Capture offline data in the field, and sync everything once you reestablish an internet connection. No more paper forms, and no more outdated details, so everybody stays on the same page.
 Upgrade your paper forms. Adopt Survey123 for ArcGIS. These smart forms can be accessed and filled out from anywhere, creating smarter, streamlined workflows with the click of a button. Complete forms offline and upload completed surveys to ArcGIS as soon as you have internet. With the ability to upload before returning to the office, the analysis can begin before you’ve left the field.
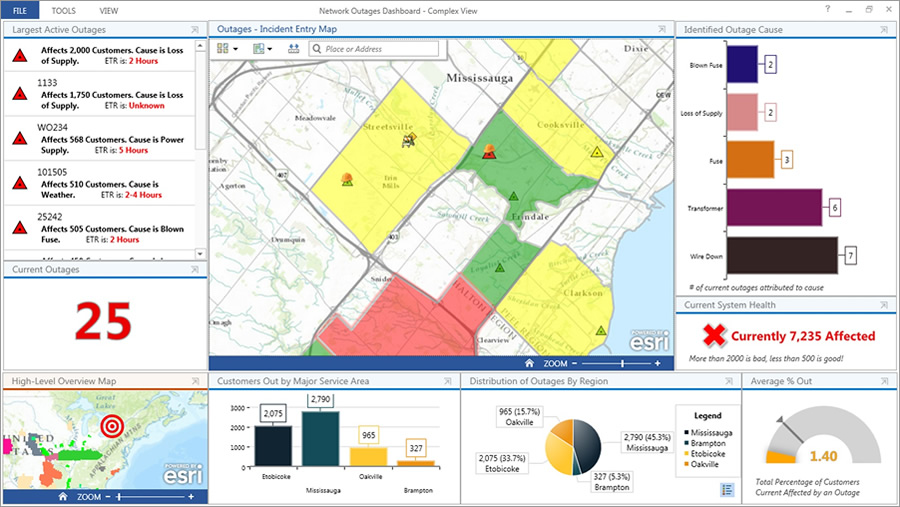
 Stay ahead of the curve with Operations Dashboard. Outlining key performance indicators (KPIs), dashboards give a clear cut view of your entire operation. Track the metrics that are most important to your business. For vegetation management surrounding electric utility lines, the KPIs displayed on the dashboard might include:
– A map of the entire network area, color-coded based on priority level
– Total number of critical locations in need of vegetation management
– List of top priority assignments yet to be completed
– Number of downed trees in need of removal
– Key metrics measuring various field crews, to identify the most and least efficient crews
Operations Dashboard is a versatile tool from ArcGIS, giving you the power of knowledge to quickly see the status of your entire network at a glance.
Vegetation management with GIS has never been easier. With a range of remote sensing and GIS technologies, we can collect highly-detailed hyperspectral imagery to create a 3D picture of vegetation near power line assets. And with the implementation of ArcGIS technologies, we can streamline the vegetation management process, while measuring KPIs along the way. Evolve your vegetation management practices with GIS.
Get Support
Jumpstart your GIS capabilities with a little help from GeoMarvel. Reach out to our team of industry experts to start a conversation about your unique GIS needs today.